Cluster map
cluster_map.RmdMaking the map
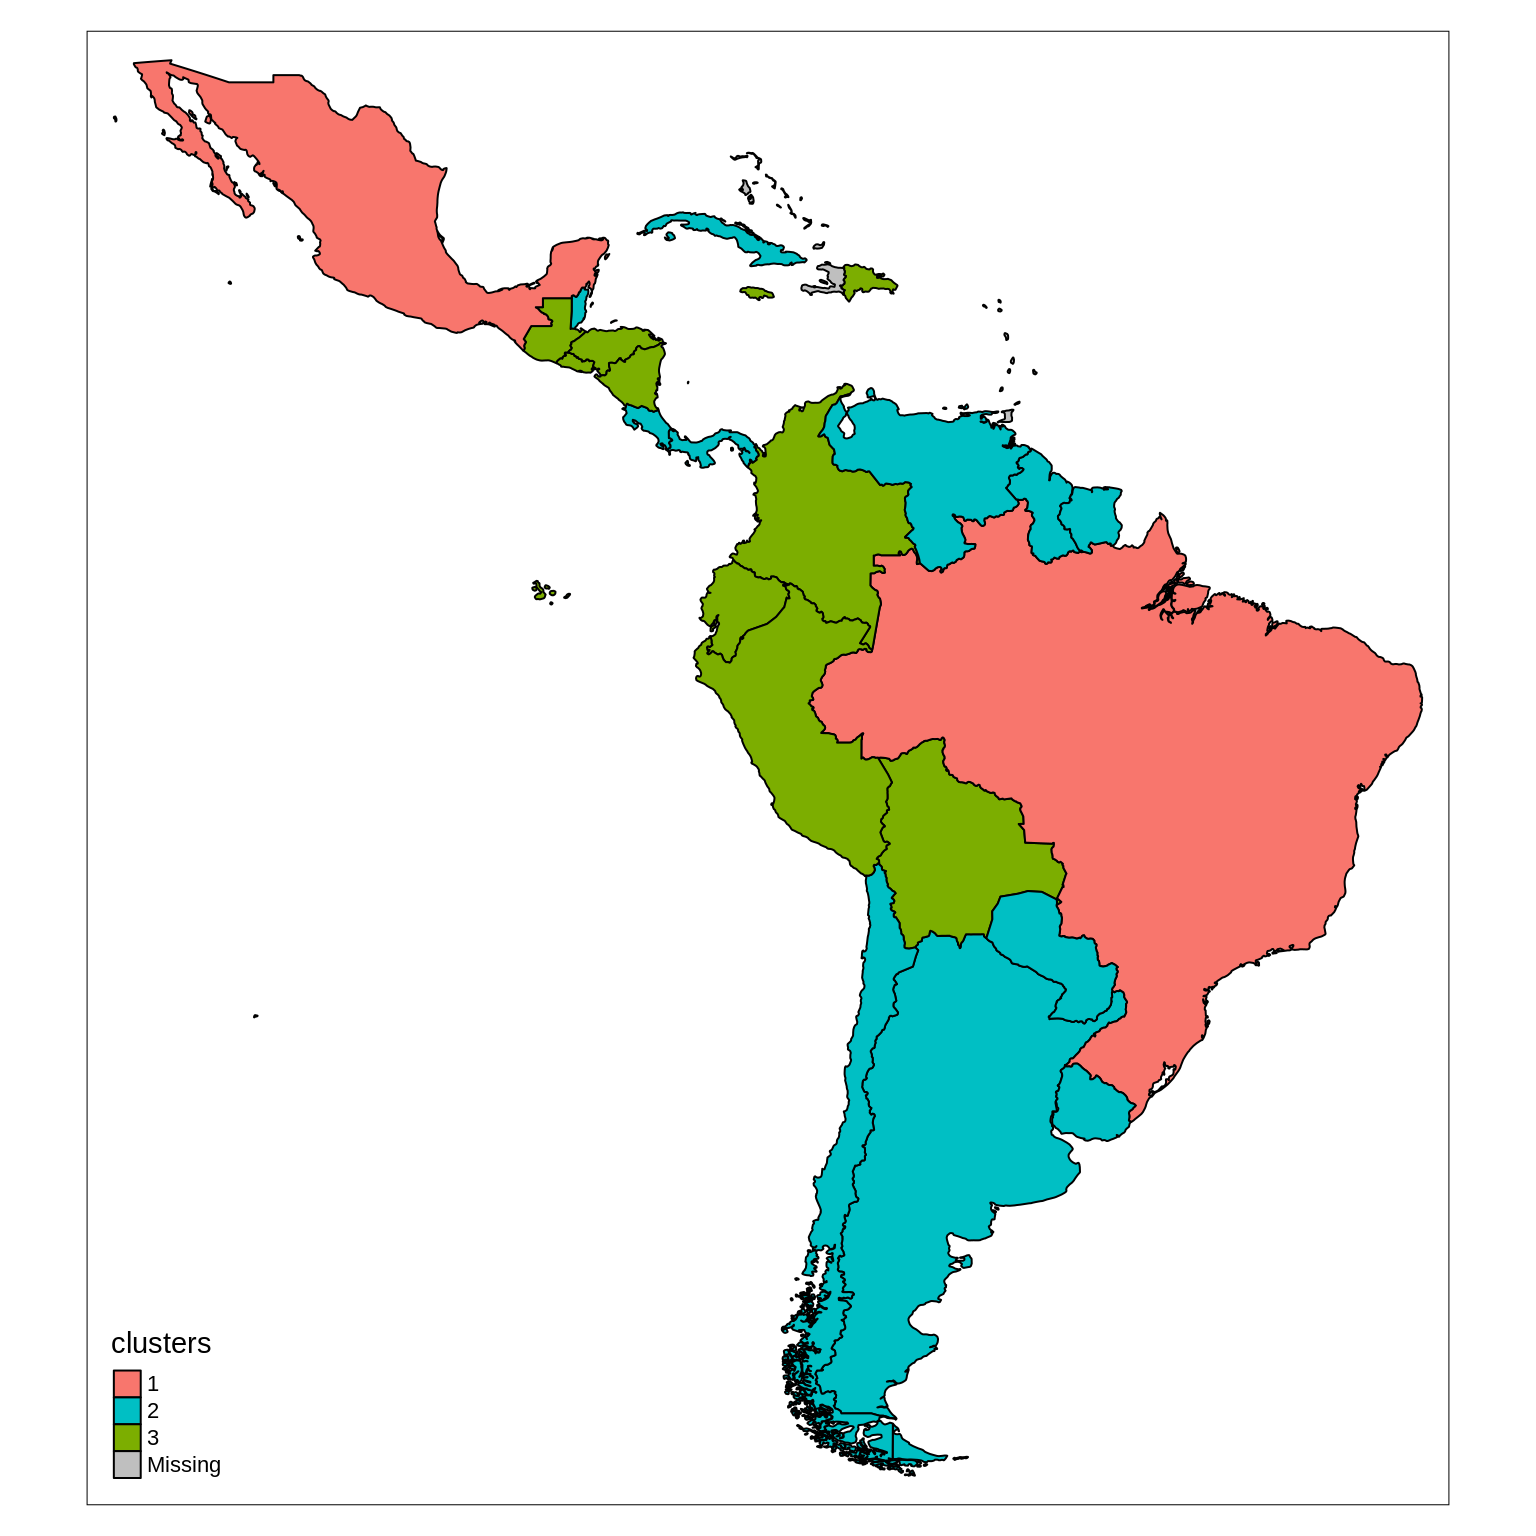
The country clusters are loaded from country_clusters.csv.
countries_shapefile <- join_database_shapefile(
  read_countries_database("countries_clusters.csv"),
  read_countries_shapefile()
)
The map is then produced using tmap package.
colors <- c("#F8766D", "#00BFC4", "#7CAE00")
tm_shape(countries_shapefile) +
  tm_fill(col = "clusters", palette = colors) +
  tm_borders(lwd = 1, col = "black")